If you’re running Starlink across more than a couple of sites, you’ll know that monitoring a fleet of dishes is a different problem from monitoring one. The Starlink app gives you per-dish status. The enterprise API gives you cloud telemetry at 15-second intervals. Neither tells you what’s actually happening at the dish, second by second, across every terminal in your fleet, in one place.
We’re extending Nexus Telemetry to fill that gap.
We spent three years designing and deploying the first Starlink Enterprise management platform for a major reseller. Provisioning, fleet telemetry, proactive monitoring, business intelligence across large terminal deployments. So we know what the enterprise API gives you and where the gap is. It can tell you that a terminal is online and roughly how it’s performing. It can’t tell you what the obstruction map looks like, how alignment has changed, what happened second by second during an outage, or whether a firmware update improved or degraded a specific terminal. That data only exists on the local network, and only gets captured if something is there to collect it.
We shipped multi-source GPS into Nexus Telemetry a couple of weeks ago, ahead of Starlink’s 20 May local API change. USB, network, gpsd, all configurable, no cloud dependency. It’s the first visible piece of the fleet-scale architecture we’re building. This post is where we’re heading next.
If you’re managing unattended or multi-terminal Starlink deployments, we’d like your help shaping what we build. Read on for the approach, or get in touch if you want to be involved.
The approach
We’re separating collection from visualisation.
A lightweight Nexus Telemetry collector runs unattended at each Starlink site. Run it as a container on a server or network device you already run, or on a Raspberry Pi, a mini PC, anything that stays on. It captures telemetry continuously and stores it locally. A central fleet server pulls from those collectors and serves a web dashboard that anyone on the network can reach from a browser.
One dish on a roof with a Pi in the loft. Ten dishes across a marina. Fifty terminals on a fleet of vehicles. Same architecture, scaled to suit.
No cloud
The architecture is fully distributed. No data leaves your network. No third party sits between you and your terminals. The fleet server runs on your hardware, whether that’s a machine in the comms room, a rack server, or a VPS you manage. You own the monitoring stack.
For operators who’d rather not run the infrastructure themselves, we’ll offer hosted fleet instances. Same software, same architecture, just running on a server we manage on your behalf. The self-host option is always there.
Multi-user access
The fleet server has authentication and role-based access control built in. Administrators manage terminals and configuration. Operators can acknowledge alerts and trigger diagnostics. Viewers get read-only dashboard access. Multiple people can monitor the same fleet from different locations without sharing a machine or a VPN session.
Where the data lives
Each collector stores its own telemetry locally. The fleet server periodically syncs aggregate data from each collector and keeps a local copy.
What the fleet view looks like
A fleet dashboard has a different job from the Pro dashboard. Pro goes deep on one terminal. Fleet is about triage. You need to spot the terminals that need attention and let everything else fade into the background. When everything is healthy, the view should feel calm. When something degrades, that terminal should stand out without the operator having to scan through a table looking for it.
We’re designing around a single unified view with progressive filtering, rather than a rigid drill-down hierarchy. Filter by account, fleet, tags, or status, and everything recalculates for the current scope. Click through to any terminal and you’re in the full Pro diagnostic experience, just pulling from a remote collector instead of a local dish.
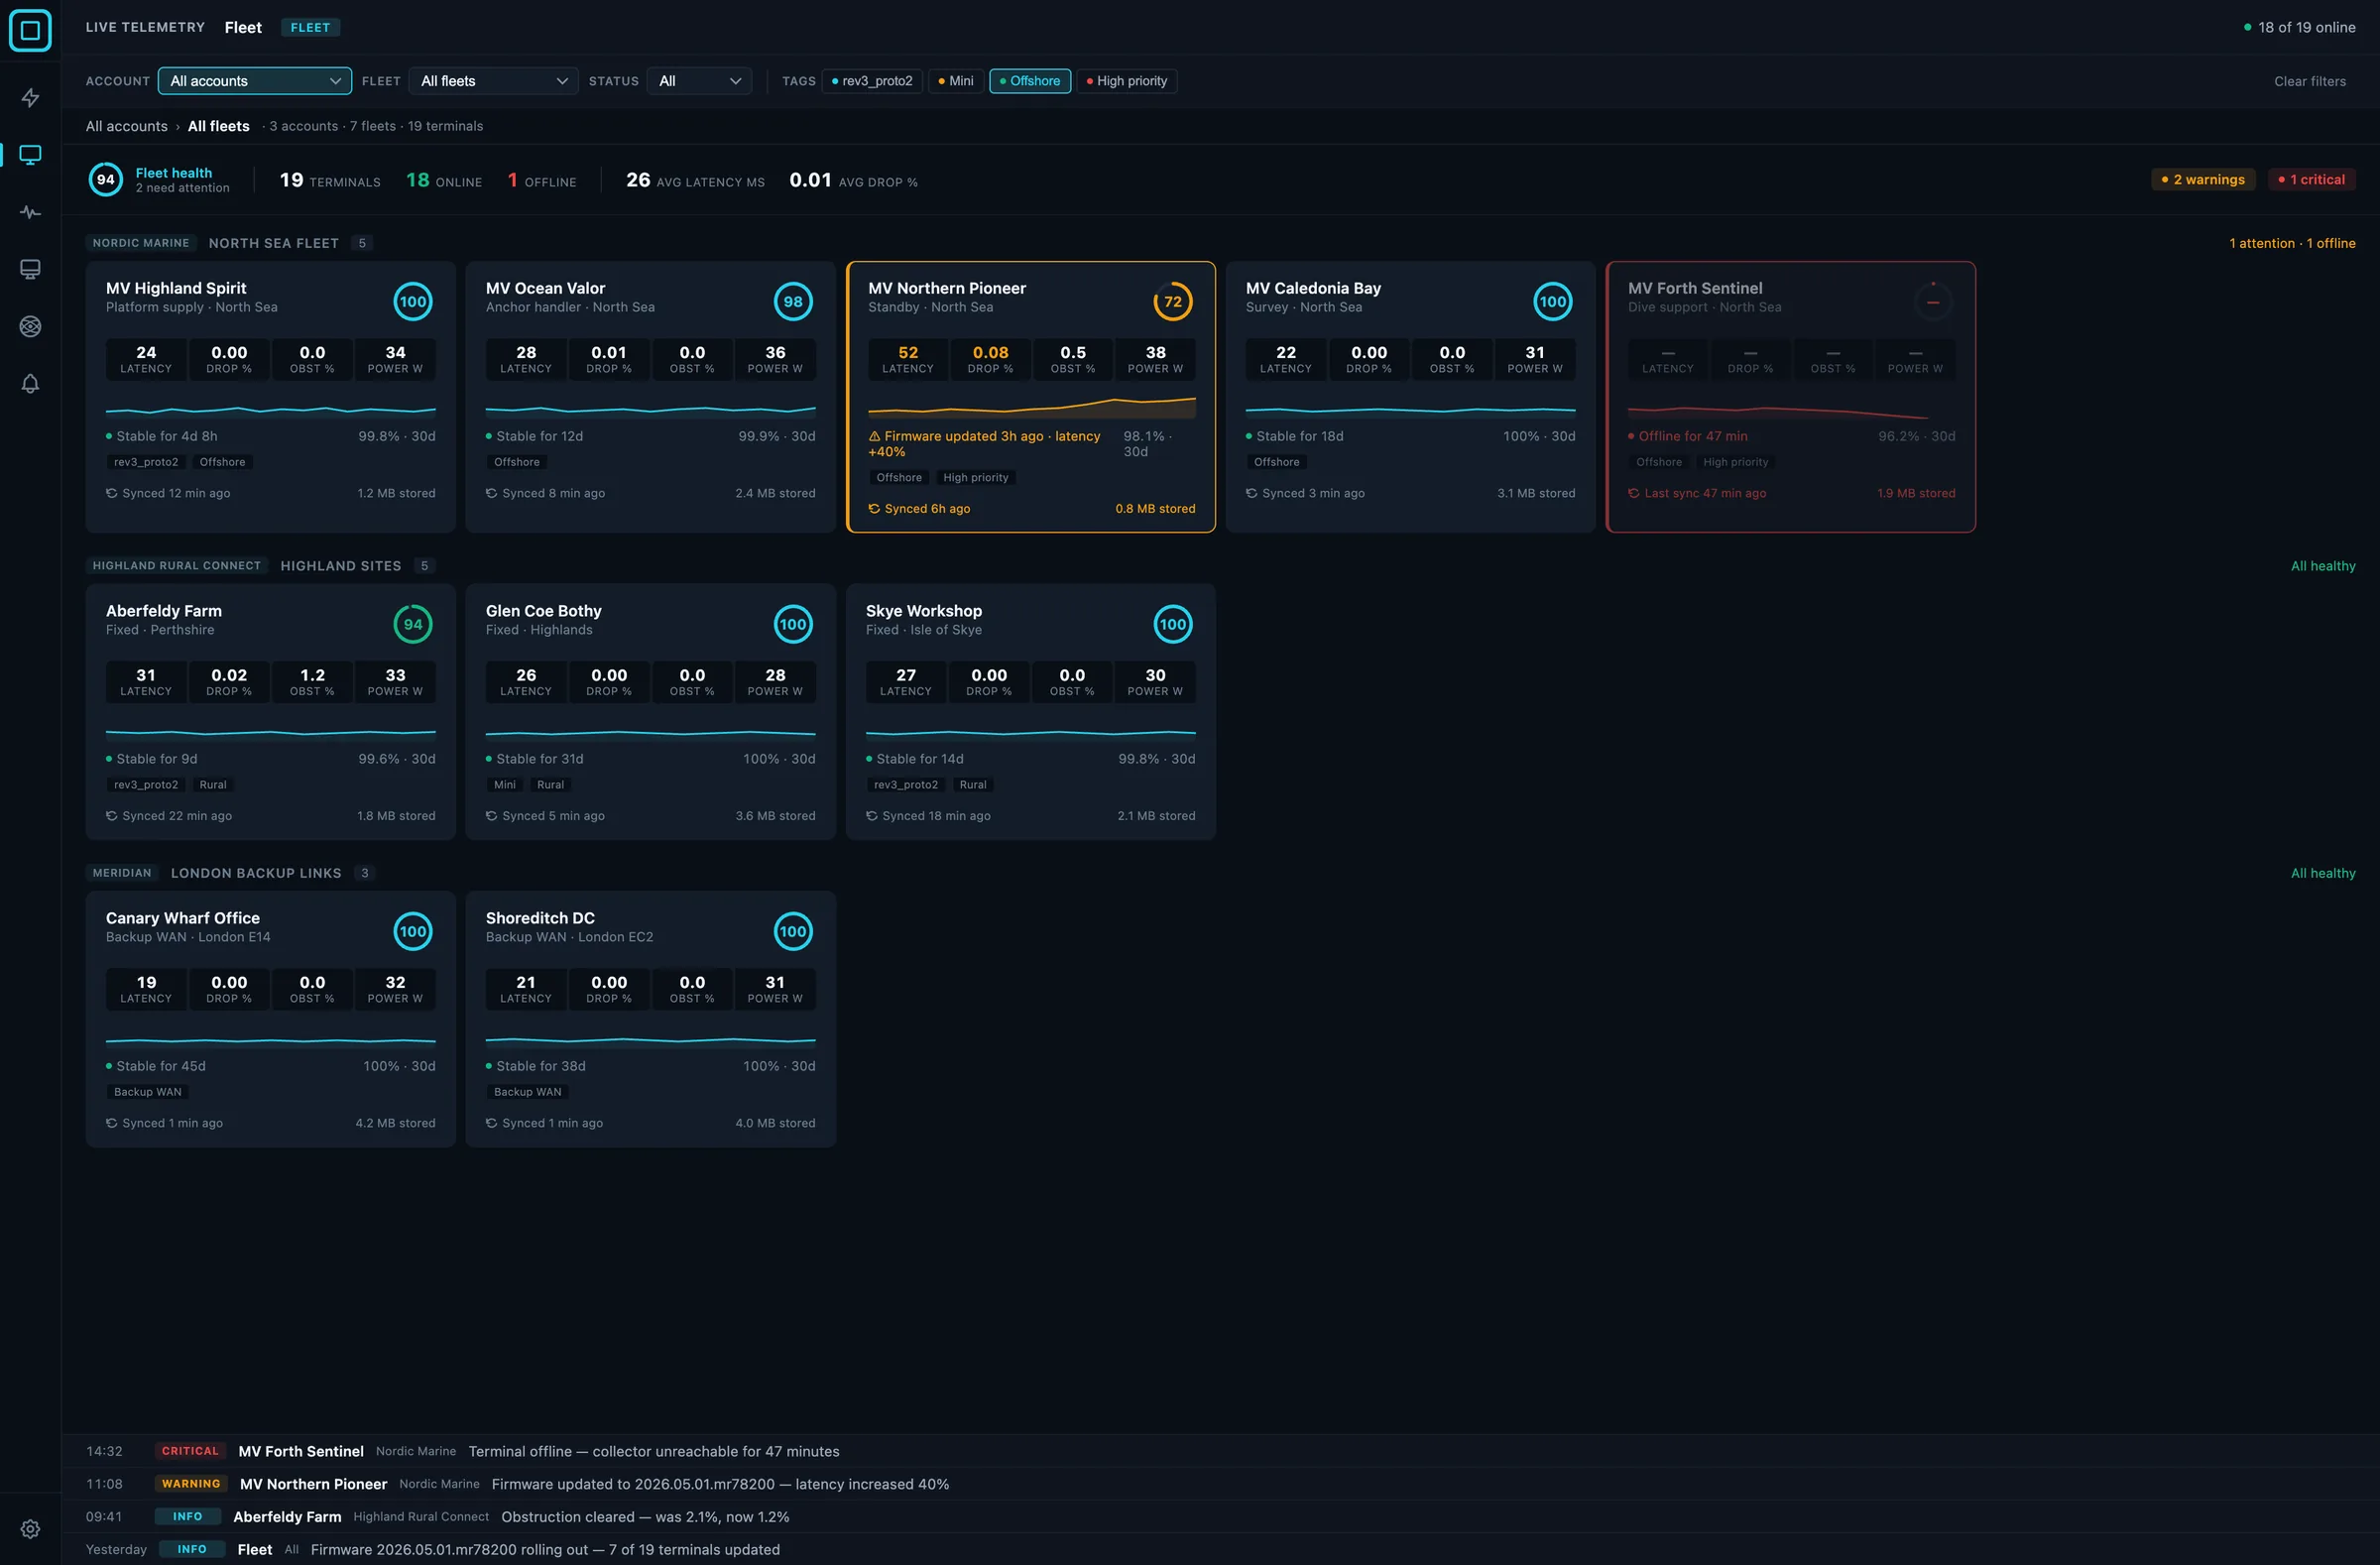 The unified fleet view, with progressive filtering and triage-first layout.
The data hierarchy
The fleet view is organised around a simple structure. Accounts are the top-level boundary, usually a customer or an organisation. Fleets sit inside accounts, grouping terminals that belong together operationally. A set of vessels. A region of fixed sites. A collection of backup links. Terminals are the individual dishes, each with a collector reporting telemetry.
Tags cut across the whole structure. Tag terminals by hardware revision, priority level, use case, or anything else that’s useful to you. Filter by tag across accounts and fleets to slice the data however you need it.
A single fleet operator with one account sees their fleets and terminals. A service provider managing multiple customers sees multiple accounts, each with their own fleets. Same view, same filters, different scope.
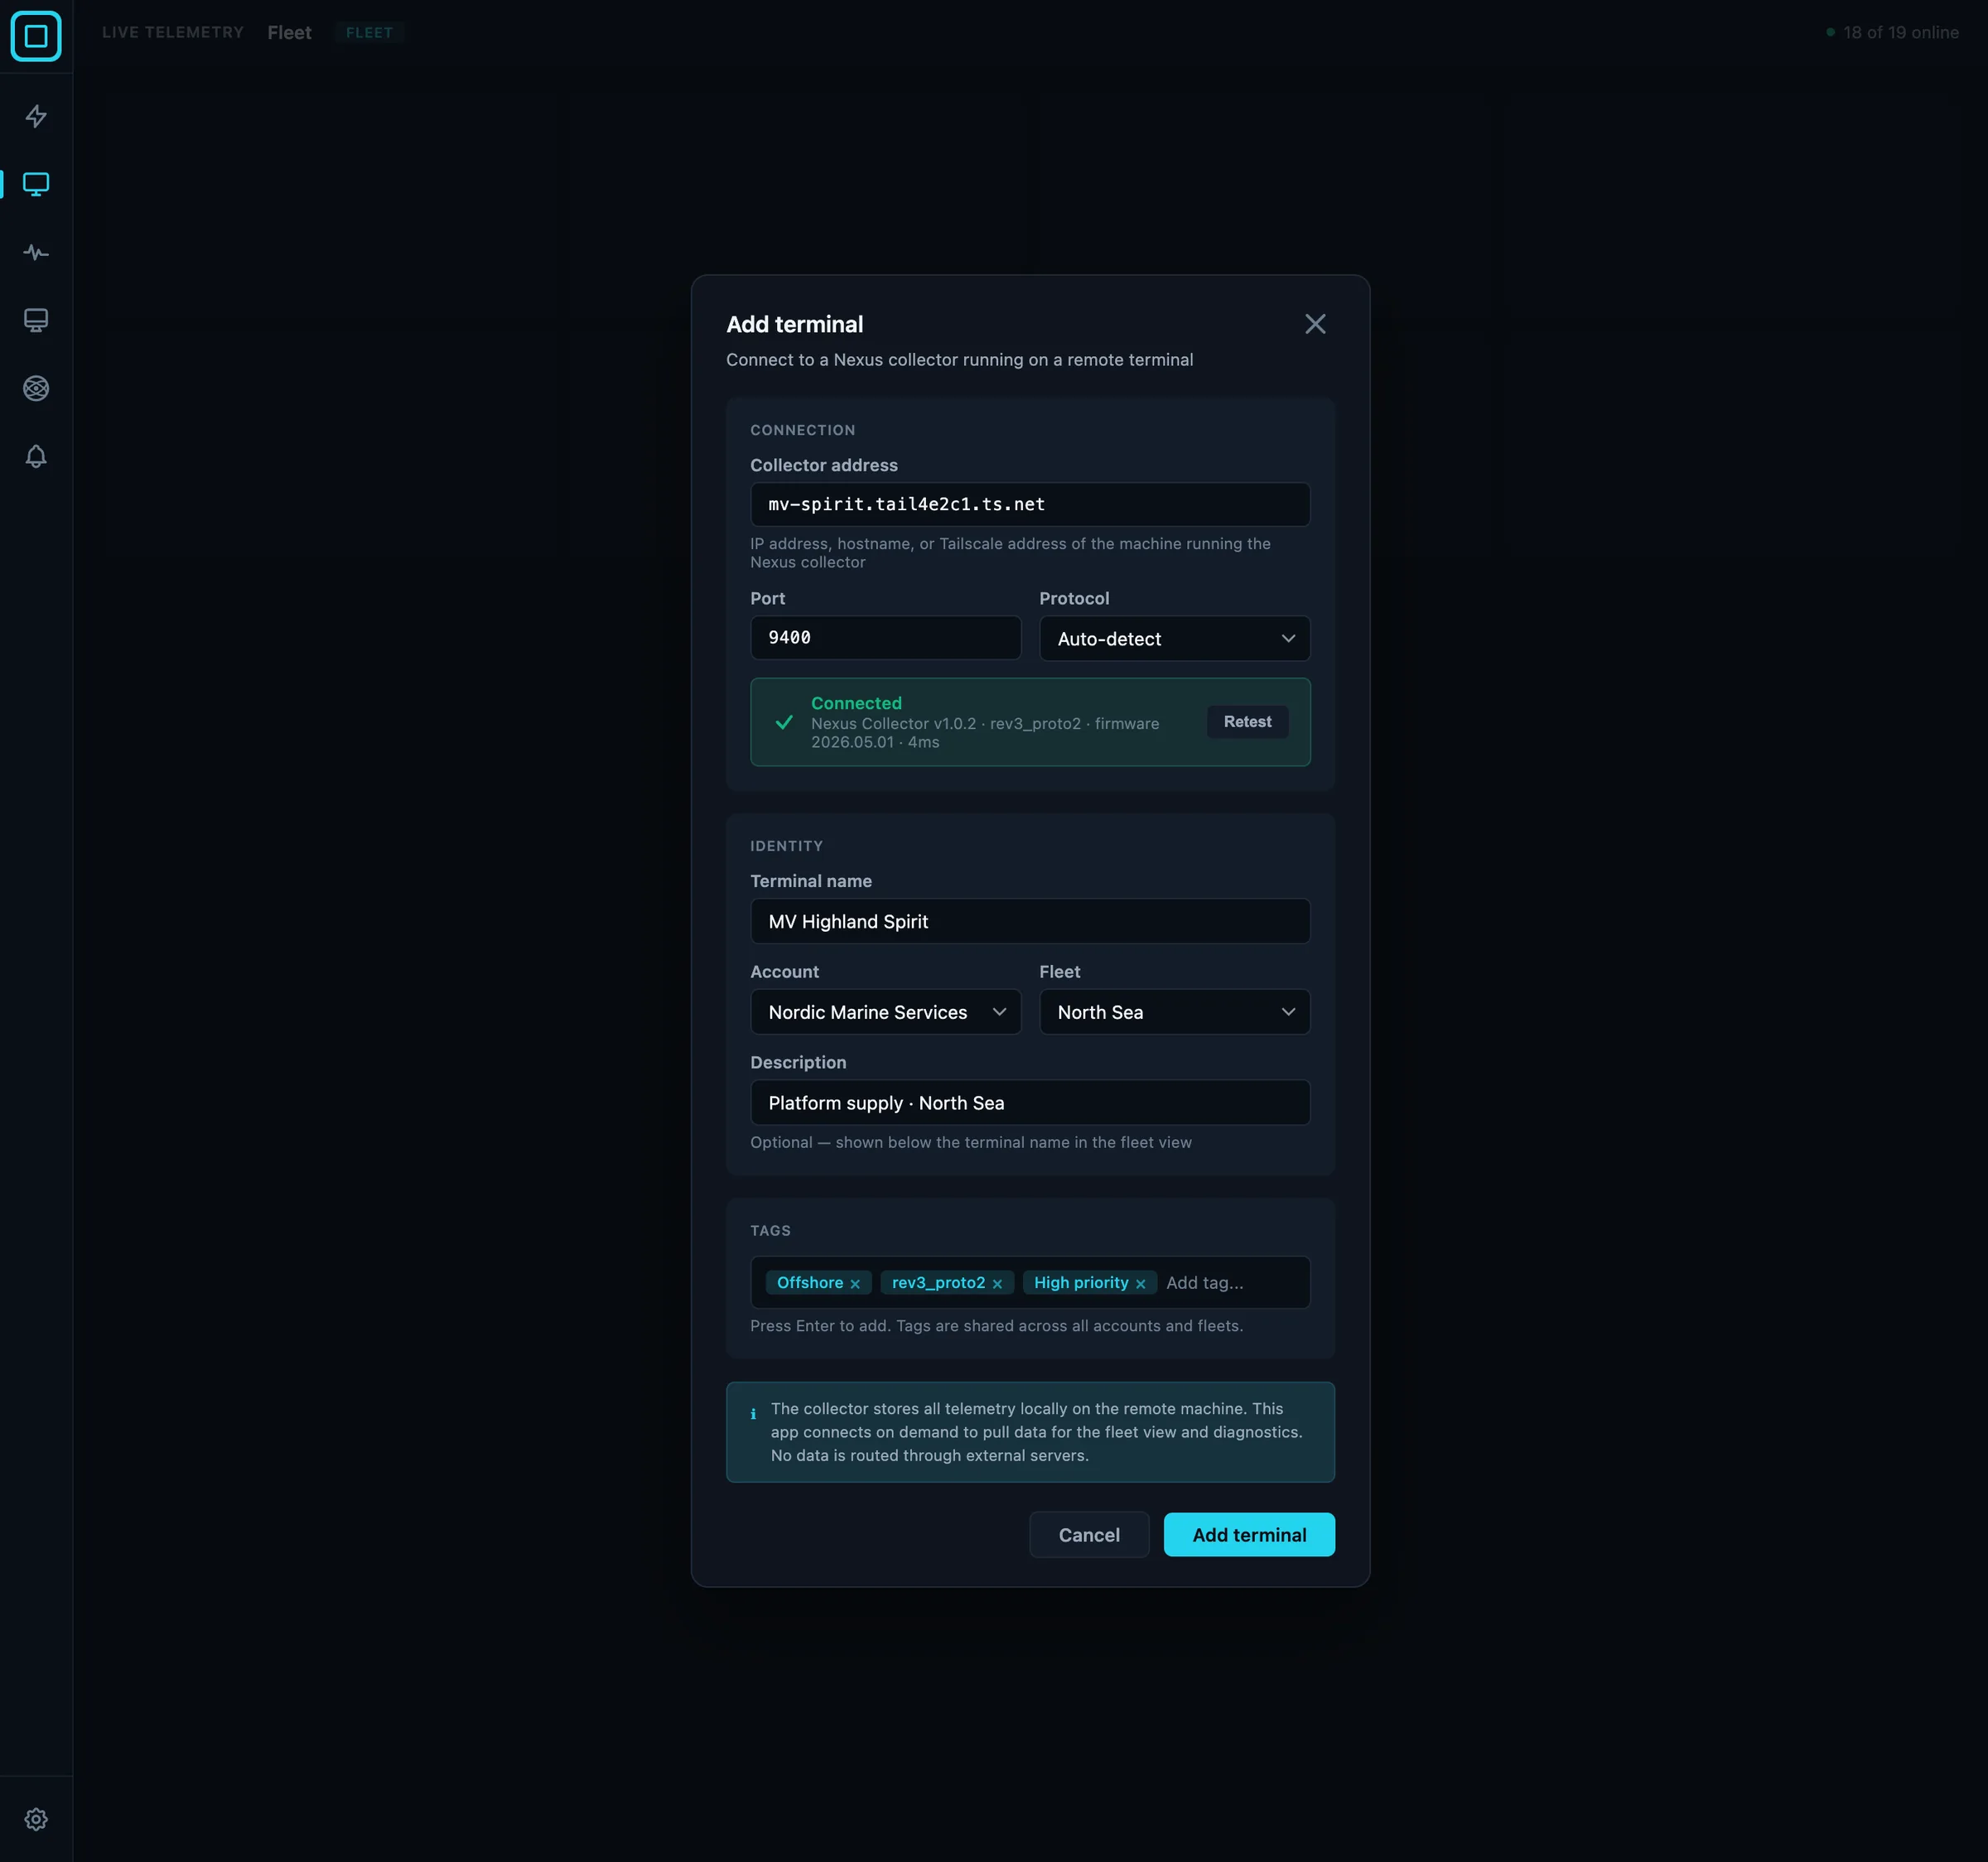 Adding a terminal to a fleet, with account, fleet, and tag assignment in a single step.
Who this is for
Operators running multiple Starlink terminals: marine fleets, managed service providers with distributed customer deployments, businesses running Starlink at remote or unattended sites. If that’s you, we’d like to hear from you.
Shape what we build
We’re building this around real operational requirements, not guesses.
If you’re managing unattended or multi-terminal Starlink deployments, we’d like to spend 30 minutes with you on three things:
- How you currently monitor your terminals, or wish you could.
- The one piece of telemetry you most need visibility into.
- What would have to be true for a fleet monitoring tool to be worth deploying at your sites.
In return: early input on the roadmap, founding-customer pricing when we ship, and beta access months before public release.
If you’re also on Starlink’s enterprise platform, optional integration with the Starlink Enterprise API is on the roadmap. Usage data, subscription status, and cloud telemetry pulled into the fleet view alongside the local collector data. Driven by demand, so worth a conversation if it matters to your deployment.
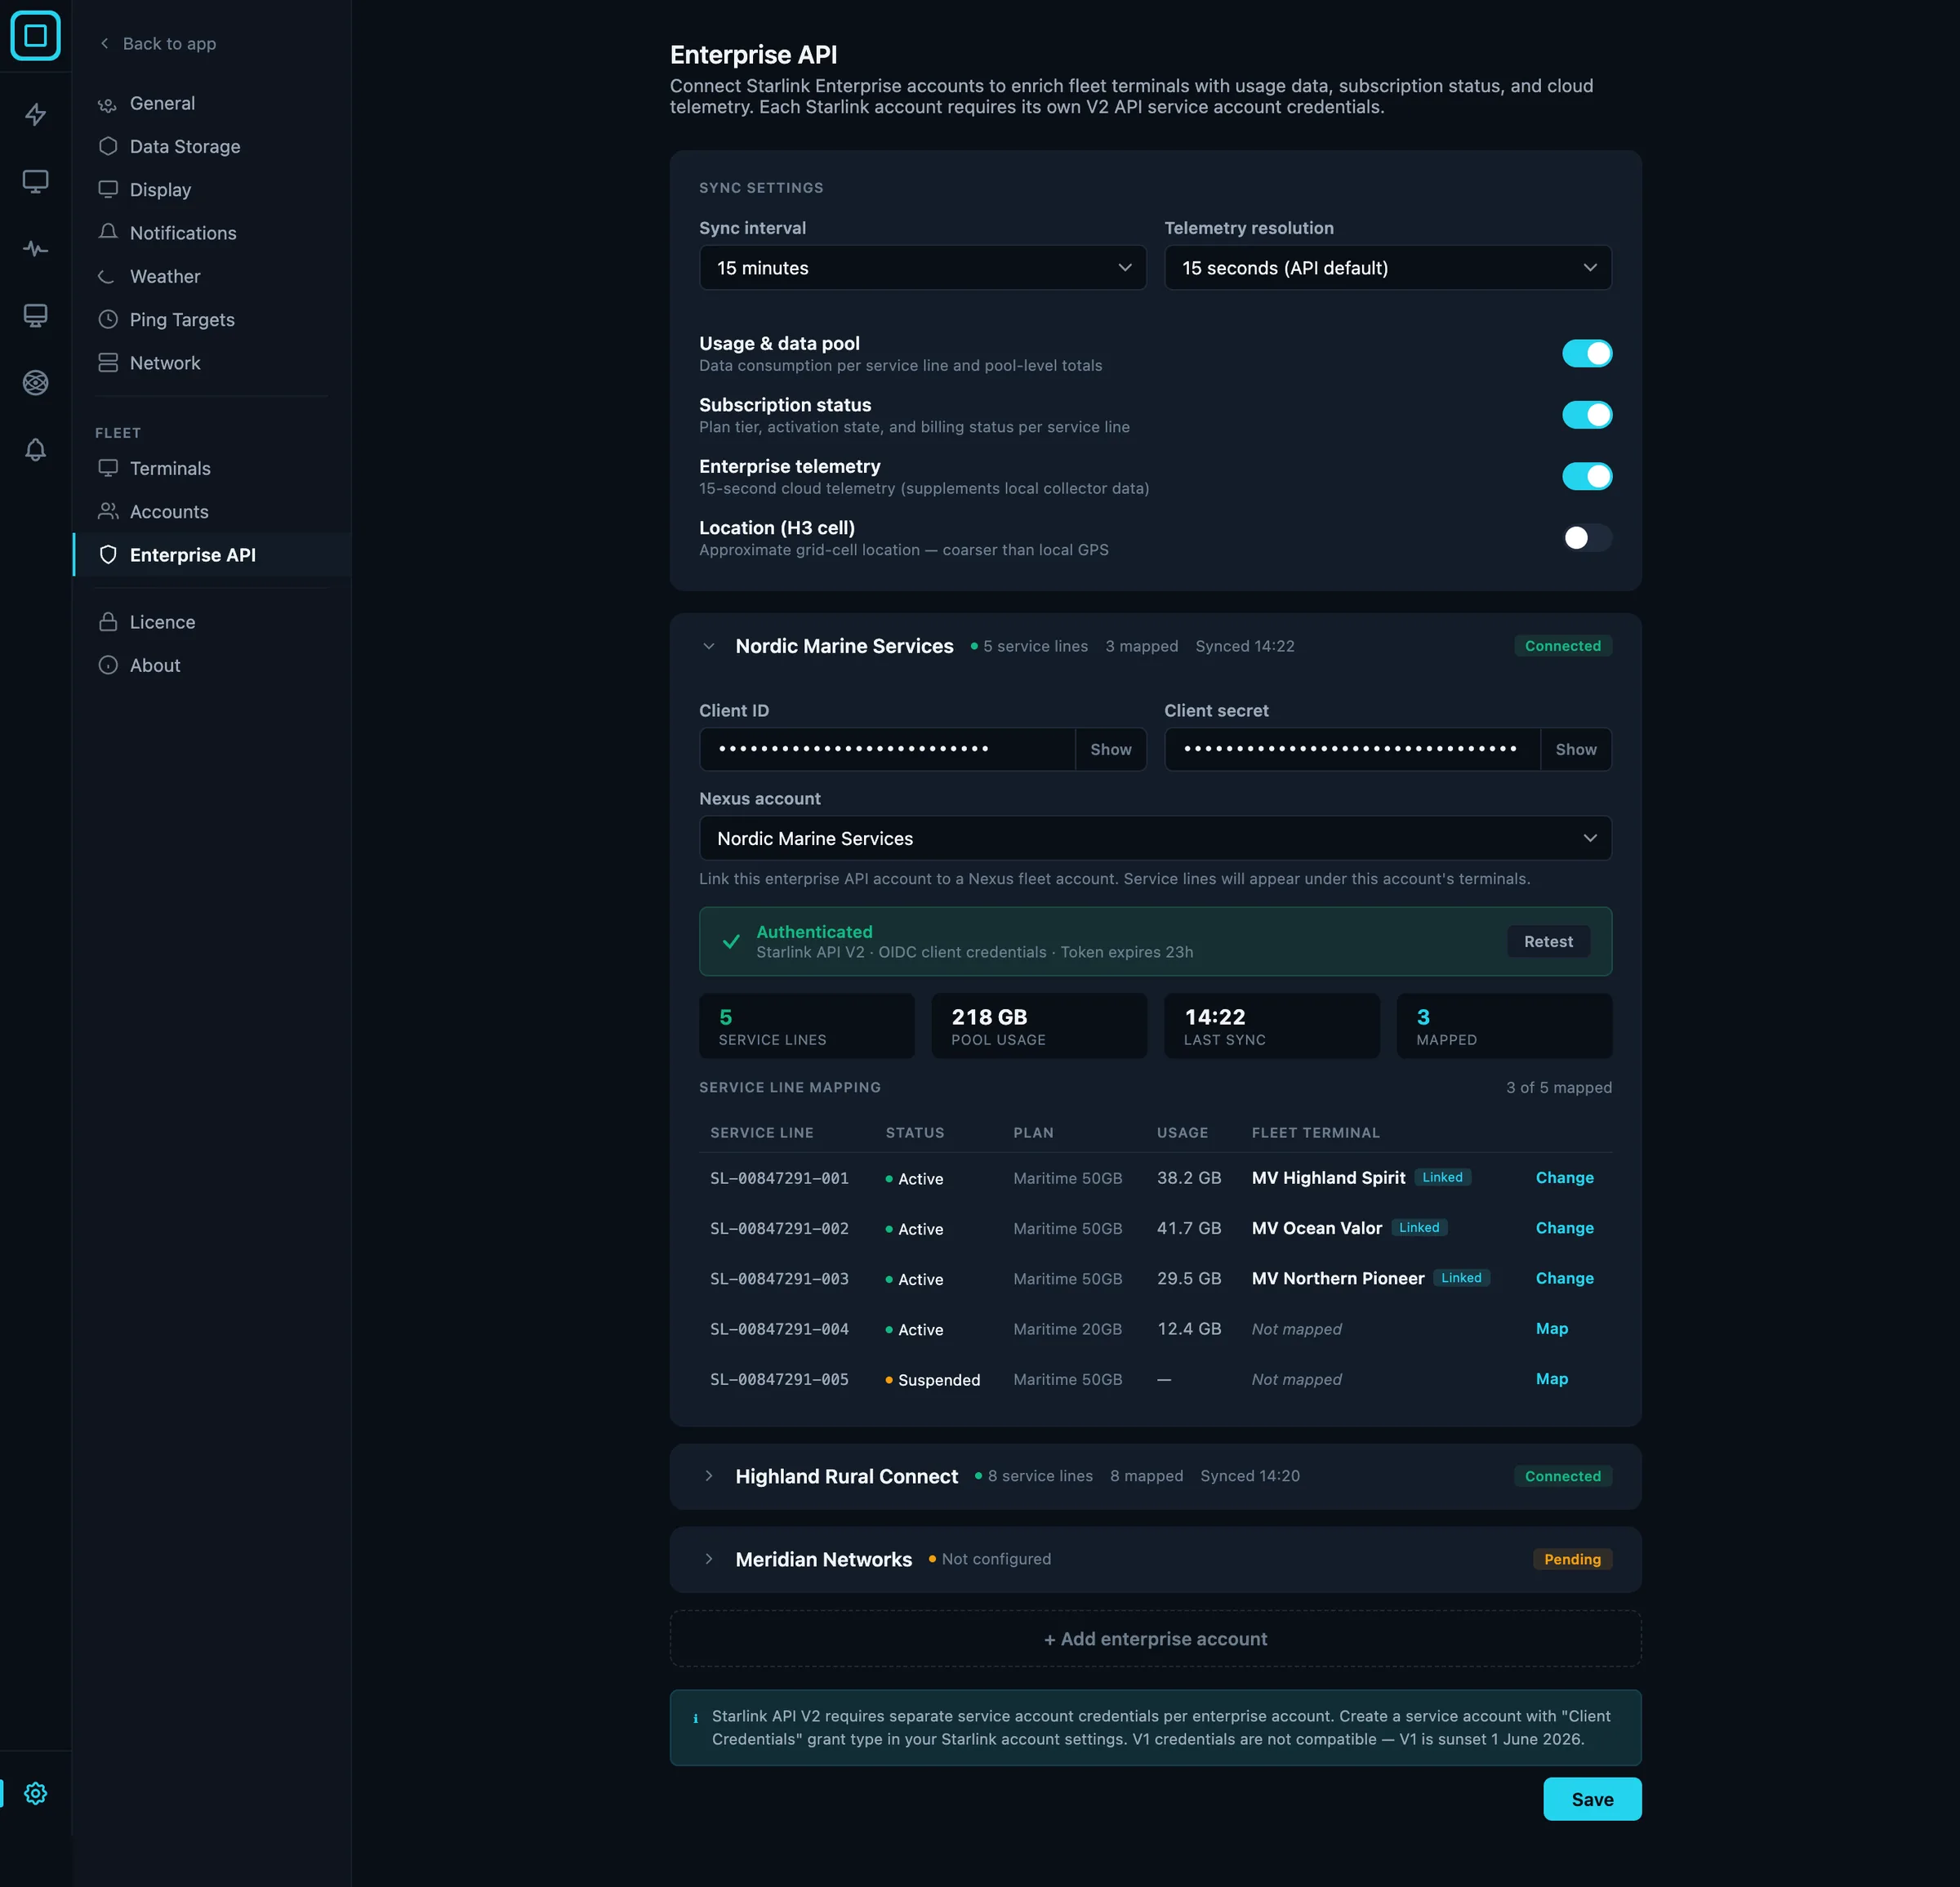 Starlink Enterprise API data folded into the same view as the local collector data: usage, subscription status, and cloud telemetry.
Get in touch at contact@liquidbinary.co.uk or nexustelemetry.com.
Nexus Telemetry is built by Liquidbinary Ltd. Follow @nexustelemetry on X or subscribe to the newsletter for new posts.