The Starlink app tells you if your internet is working. Nexus Telemetry tells you why.
Your latency spikes at 8pm every night: is that congestion, obstructions, or weather? Your connection drops for thirty seconds; was that a satellite handoff, a firmware update, or a tree branch? The app says “connected” and gives you a number. It doesn’t give you the story.
So we built the tool we wanted to use ourselves.
How it started
At the end of 2022, my broadband was terrible. Overnight the bandwidth halved and it felt like going back to dial-up. After reviewing options I decided to try Starlink and had it installed at home. I was immediately hooked and fascinated with the technology, more interested in what was coming out of the dish than what was on the screen. I started poking around the dish’s API, which is undocumented, and after some time I was pulling telemetry with community scripts from GitHub. As I delved deeper I started writing my own scripts in different languages.
It was nothing other than curiosity. I’d connect to the dish, watch the numbers stream, and try to make sense of them. What does a drop rate of 0.3% actually mean? Why does latency spike when it’s raining but not when it’s cloudy? What are all these subsystems reporting back? The official app gave me a speed and a green dot. The dish itself was broadcasting a rich stream of data that nobody was really surfacing.
Around the same time, we were blazing a trail in the Starlink Enterprise space, among the first to design and build a management platform on the Starlink Enterprise API for a major reseller. That work was fascinating in its own right: provisioning, subscription management, fleet operations at scale. But the enterprise API operates at a distance from the terminals themselves. It doesn’t give you the rich, real-time data that the dish broadcasts locally: the raw telemetry, the location data, the obstruction maps, the satellite counts. I knew that data was there because I was pulling it out of my own dish, poking around undocumented endpoints, writing binaries to decode what the terminal was actually reporting. The consumer side of Starlink, how an individual dish connects to satellites in space, how it steers its beam, how it handles weather and obstructions, was endlessly more interesting to me.
Over the next couple of years, I kept experimenting. Different scripts, different visualisations, different ways of trying to pull the data out and present it. I never expected it to go anywhere as I could not think of a secure way to surface this outside of a user’s network. I assumed the enterprise work was the bleeding edge and this data would surface there in time, but I soon realised the enterprise API lags behind what the terminal itself can tell you, and it lags considerably.
The turning point
Having concluded a successful Starink Enterprise project at the end of 2025, professionally handed over to the client to run their own Starlink Enterprise platform, we had a decision to make. We had just completed the first ever enterprise reseller platform; where do we take it next?
Honestly, I was exhausted. More than ten years of intense enterprise web application development had taken its toll. I wanted something new. 2026 was going to be our year for Rust, a language we’d been watching from the sidelines and would complement my fascination with assembly programming. We’d done a lot with HTMX and Node.js, and I’d realised we didn’t need to be so tightly coupled to any one runtime. I was also concerned about the vulnerability of the supply chain in NPM and decided the time was right to take stock.
I was also thinking about the broader landscape. There’s genuine uncertainty around web application development and SaaS businesses right now with the rise of AI. I believe we’ll see something of a renaissance in desktop applications: native software that runs on your machine, works offline, and doesn’t depend on someone else’s cloud staying online.
And when we looked at the Starlink consumer space, we were surprised. Starlink was growing at an extraordinary rate, from around five million subscribers at the start of 2025 to over ten million by early 2026. A fast-growing, global market, and the desktop space was massively underserved. There was no dedicated desktop application for monitoring your connection beyond the official Starlink app. The community scripts existed, but nothing polished, nothing maintained, nothing that a non-technical user could just install and run.
That’s when the tinkering became something serious. Not playing with the terminal, but building a professional product from scratch. A completely new application, written in Rust, designed from the ground up. Could we really build the first ever desktop application for Starlink home users and professionals? Nobody else had. Let’s do it.
The challenge
We completely underestimated how hard it would be. This is way beyond writing scripts. Way beyond web development. Building a cross-platform desktop application that runs on Mac, Windows, and Linux, across both Intel and ARM architectures, is a completely different kind of difficult. Each platform has its own expectations around installation, code signing, updates, and system integration. Making it feel native everywhere while sharing a single codebase required solving problems we hadn’t encountered in years of building for the browser.
From January to April, if we weren’t sleeping, we were working on this. Absolutely focused. And the questions just kept coming. How do we service users worldwide? How do we handle 37 languages with community-driven translation? How do we build a licensing system that handles trials, activations, and offline grace periods? How do we create two editions: a Home version for the casual user and a Pro version for professionals who want deep diagnostic insight? How do we make the interface scale from a laptop screen to a large display in a control room? How do we keep it modern, information-dense without being overwhelming, and polished enough that it doesn’t feel like a side project? How do we make it secure?
It goes on and on. And at no point did we stop. We kept going, kept solving, kept building. The result is something we’re genuinely proud of, because there’s nothing else in this space, and the first product to arrive would define what people expect. We were determined to set that bar very high.
What Nexus Telemetry does
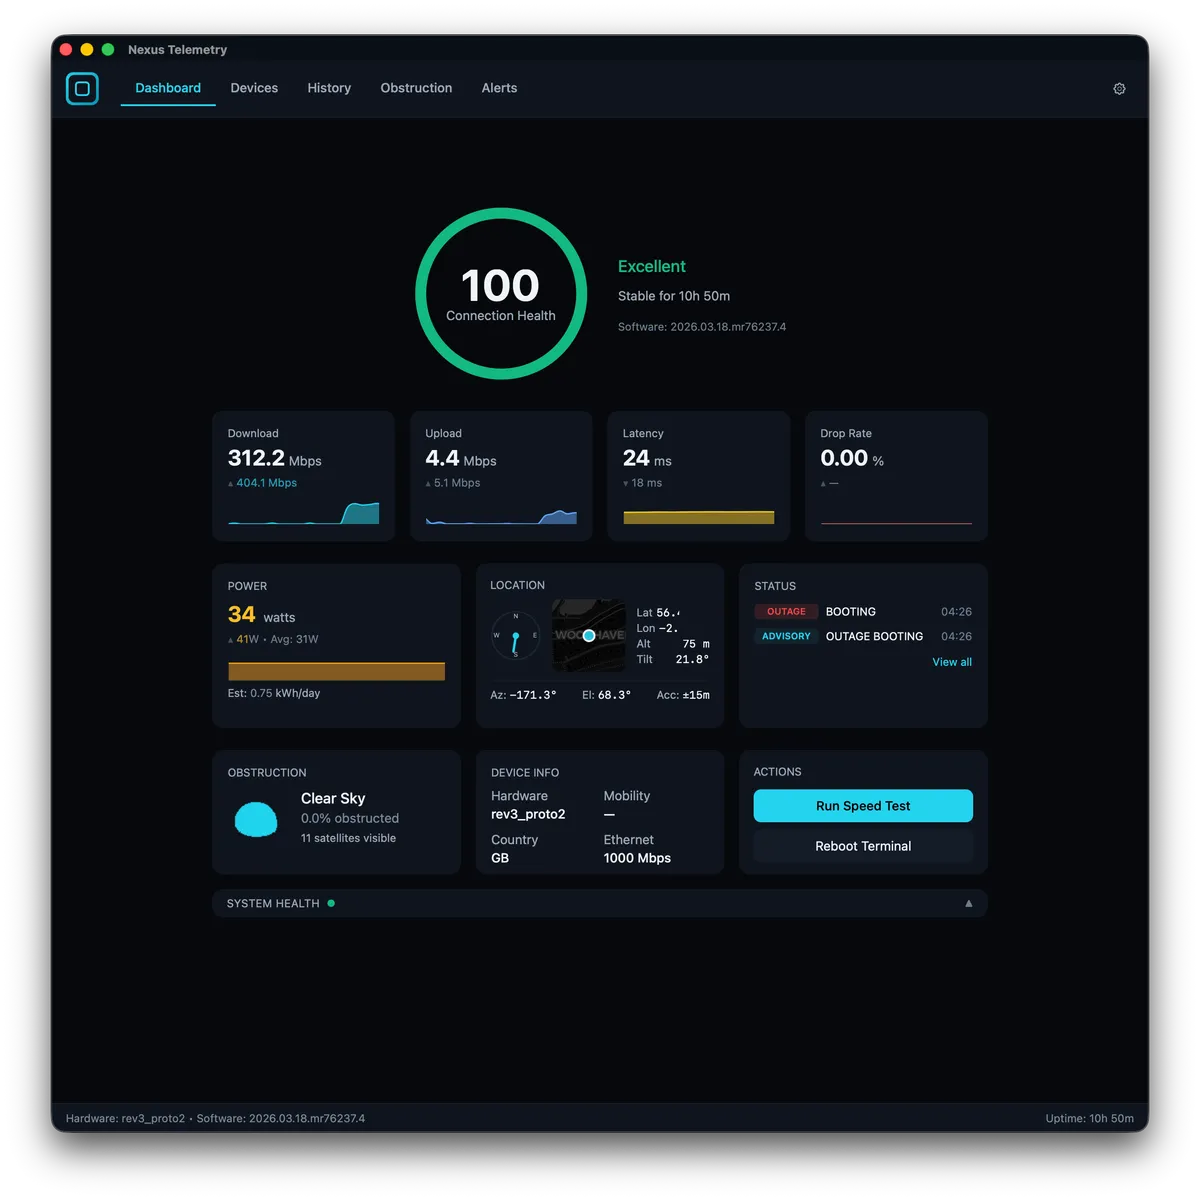
Nexus Telemetry connects directly to your Starlink dish and pulls telemetry data in real time, every second, not every fifteen seconds like the cloud APIs and dashboards. It talks to the dish on your local network. Your data stays on your machine.
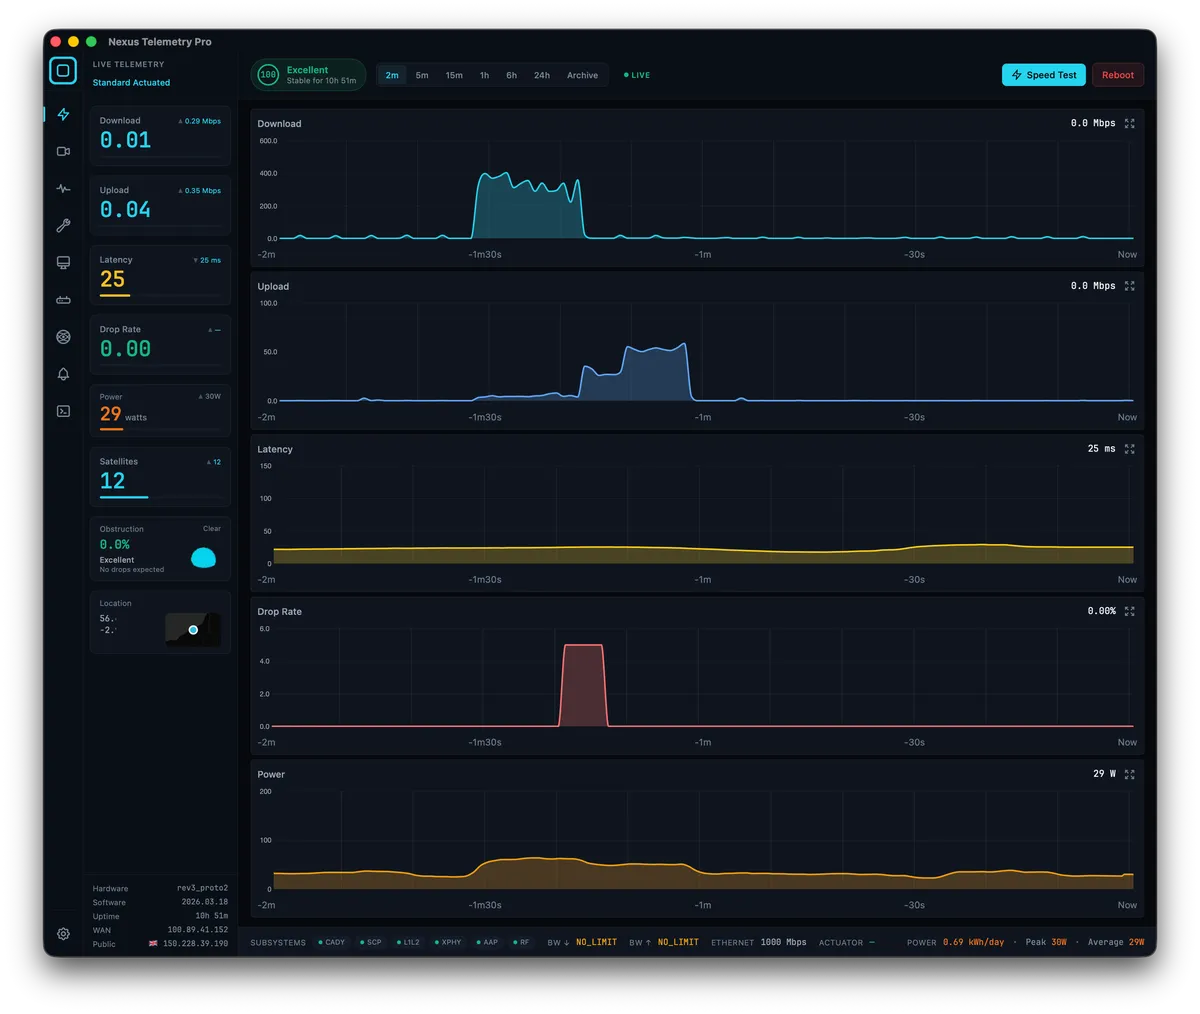
The Home edition gives you a live dashboard with streaming charts for download, upload, latency, drop rate, and power consumption. An interactive obstruction map shows you exactly where your dish has signal issues. A connection health score tells you at a glance whether things are normal. Device management lets you see connected clients, router status, and hardware details. History charts let you look back over minutes, hours, or a full day.
The Pro edition goes deeper. Multi-target ping monitoring shows you latency to endpoints across the world simultaneously, covering EU, US East, US West, and Asia Pacific, so you can see whether a latency problem is your dish or the destination. Session recording captures telemetry with GPS coordinates, so mobile users on boats, in RVs, or on the road can record journeys and replay them later with synchronised charts and route maps. Weather integration shows current conditions alongside your telemetry so you can correlate performance with what’s happening outside. Outage tracking logs every drop with duration and cause. An alert system notifies you when things degrade.
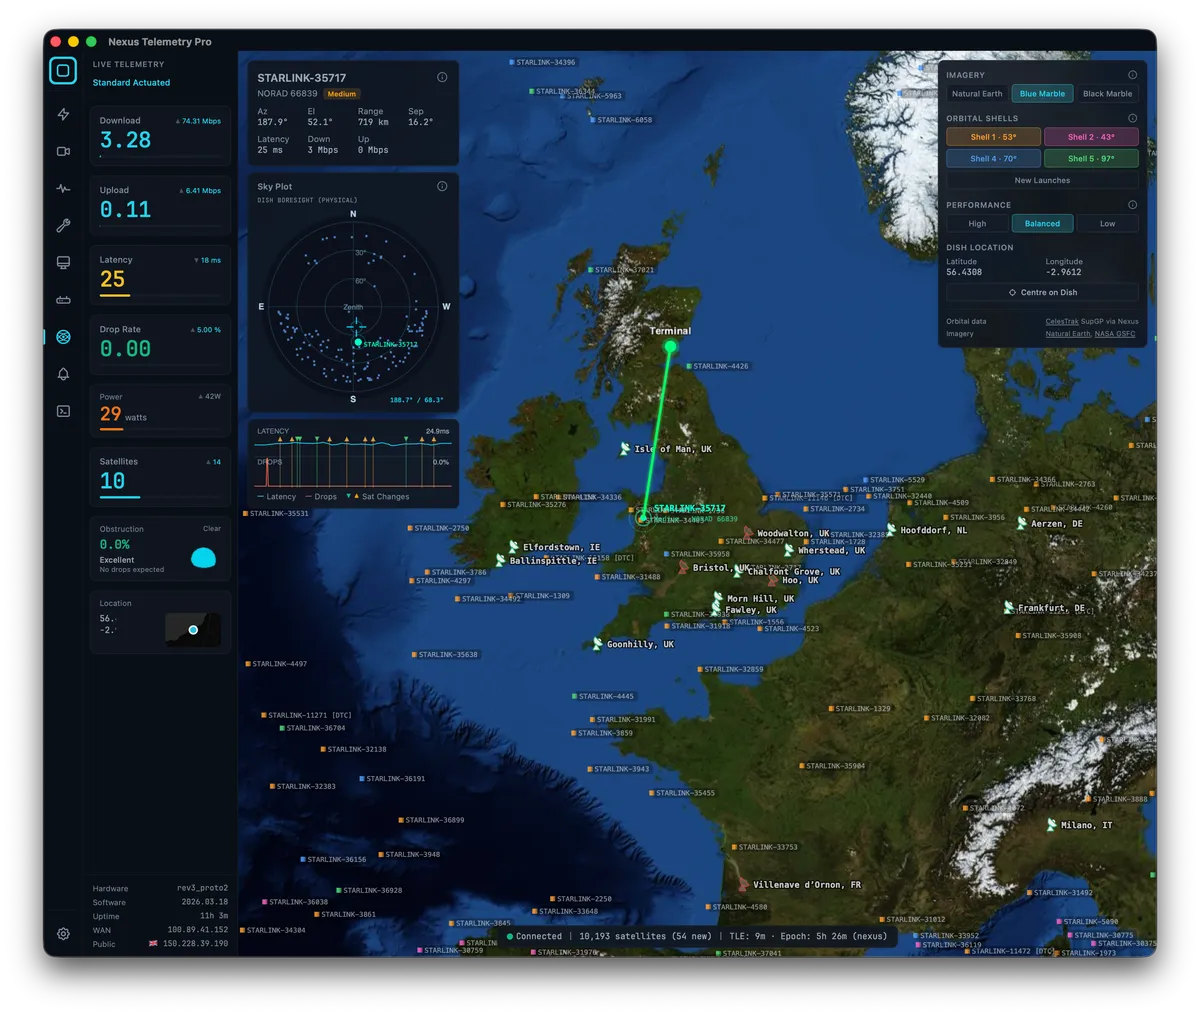
And then there’s the Starlink Viewer: a live 3D globe showing all ten thousand Starlink satellites in real time, your dish location, and an inferred connection to the satellite most likely serving your terminal. That one deserves its own blog post, and it’s coming.
Why a desktop app
This might seem like a strange choice in 2026. Why not a web app?
Because your Starlink dish sits on your local network at a fixed address. A web app would need to route your telemetry through someone else’s cloud, adding latency to the very data you’re trying to measure, and raising questions about what happens to your connection data. A desktop app talks to the dish directly.
It also means Nexus Telemetry works when your internet doesn’t. If your Starlink connection drops, you can still see the telemetry; the dish is still broadcasting its status on the local network. A cloud-dependent app goes dark at exactly the moment you need it most.
Who it’s for
Nexus Telemetry is for anyone who wants to truly understand their Starlink connection. Whether you’re a home user looking for clear performance insights, a professional monitoring a critical connection, or simply someone who wants more than a speed number and a green tick, Nexus Telemetry gives you the full picture.
For mobile Starlink users on RVs, boats, or overlanding, the session recording in Pro lets you capture and compare performance across different locations and routes.
For technical users who want to understand what their dish is actually doing at the hardware level: subsystem status, firmware versions, phased array alignment, satellite count, power draw; it’s all there.
And if you just like watching ten thousand satellites orbit the Earth in real time while knowing which one is probably beaming your internet down, honestly, that’s a perfectly good reason too.
Pricing
Nexus Telemetry ships as two editions:
Home is a one-time purchase at £24.99. It covers the dashboard, charts, obstruction map, device management, history, and connection health score. Three devices per licence.
Pro is a one-time purchase at £99.99. It adds the satellite viewer, multi-target ping, session recording, weather integration, outage tracking, alerts, network diagnostics, and configurable polling. Two devices per licence.
Both editions come with a free trial so you can see what the telemetry looks like before you commit.
Nexus Telemetry ships in 37 languages. Starlink is a global service and the monitoring tool should be too. Translations are community-driven; if something reads badly in your language, you can suggest improvements directly from within the app.
What’s next
The Starlink landscape is evolving rapidly. SpaceX is deploying new satellite generations, pushing firmware updates, expanding into new markets, and adding capacity at an extraordinary pace. V3 satellites launching later this year will bring an order of magnitude improvement in network capacity. New terminal hardware will follow. The technology doesn’t stand still, and neither do we.
Liquidbinary is committed to maintaining Nexus Telemetry through every firmware change, every new hardware revision, and every shift in how the constellation operates. Beyond that, we’re actively developing new capabilities: headless deployment for sites that need unattended monitoring, fleet management for organisations running multiple terminals, and mesh-based connectivity for distributed environments. We’re all in on this space.
The roadmap is shaped by what users actually need, not feature lists designed to impress investors. If something would help you understand your Starlink connection better, we want to hear about it.
We’ll be writing more here about the technical side of Starlink monitoring: what the telemetry data means, how to interpret obstructions, how weather affects performance, and the satellite tracking inference work that went into the Starlink Viewer. If you’re interested in Starlink beyond “is it fast enough,” there’s a lot to dig into.
You can download Nexus Telemetry and start the free trial at nexustelemetry.com. Follow @nexustelemetry on X for updates.
Nexus Telemetry is built by Liquidbinary Ltd. Follow along at @PDSCodes or subscribe to the newsletter for new posts.