Starlink fleet monitoring, direct from every terminal.
If you run more than a couple of Starlink terminals, you already know the problem. The Starlink app shows you one dish at a time. The enterprise API gives you cloud telemetry every 15 seconds. Neither gives you your whole fleet, live, in one place, read straight from each terminal, so you catch a problem at a remote site before anyone else does.
That’s what we’ve built into Nexus Telemetry Fleet, and today we’re opening it up.
We’re running a founding-operator beta in August, with limited places. If you operate or resell multi-terminal Starlink, this is the moment to put your hand up.
What it actually does
A lightweight collector runs alongside each Starlink, as a binary, a container, or on a dedicated appliance. It reads the dish directly and stores the telemetry locally, so nothing is lost if the link drops. Each collector pushes out to a fleet server you host yourself or we host for you. Outbound-only, so it works through any firewall with no ports to open.
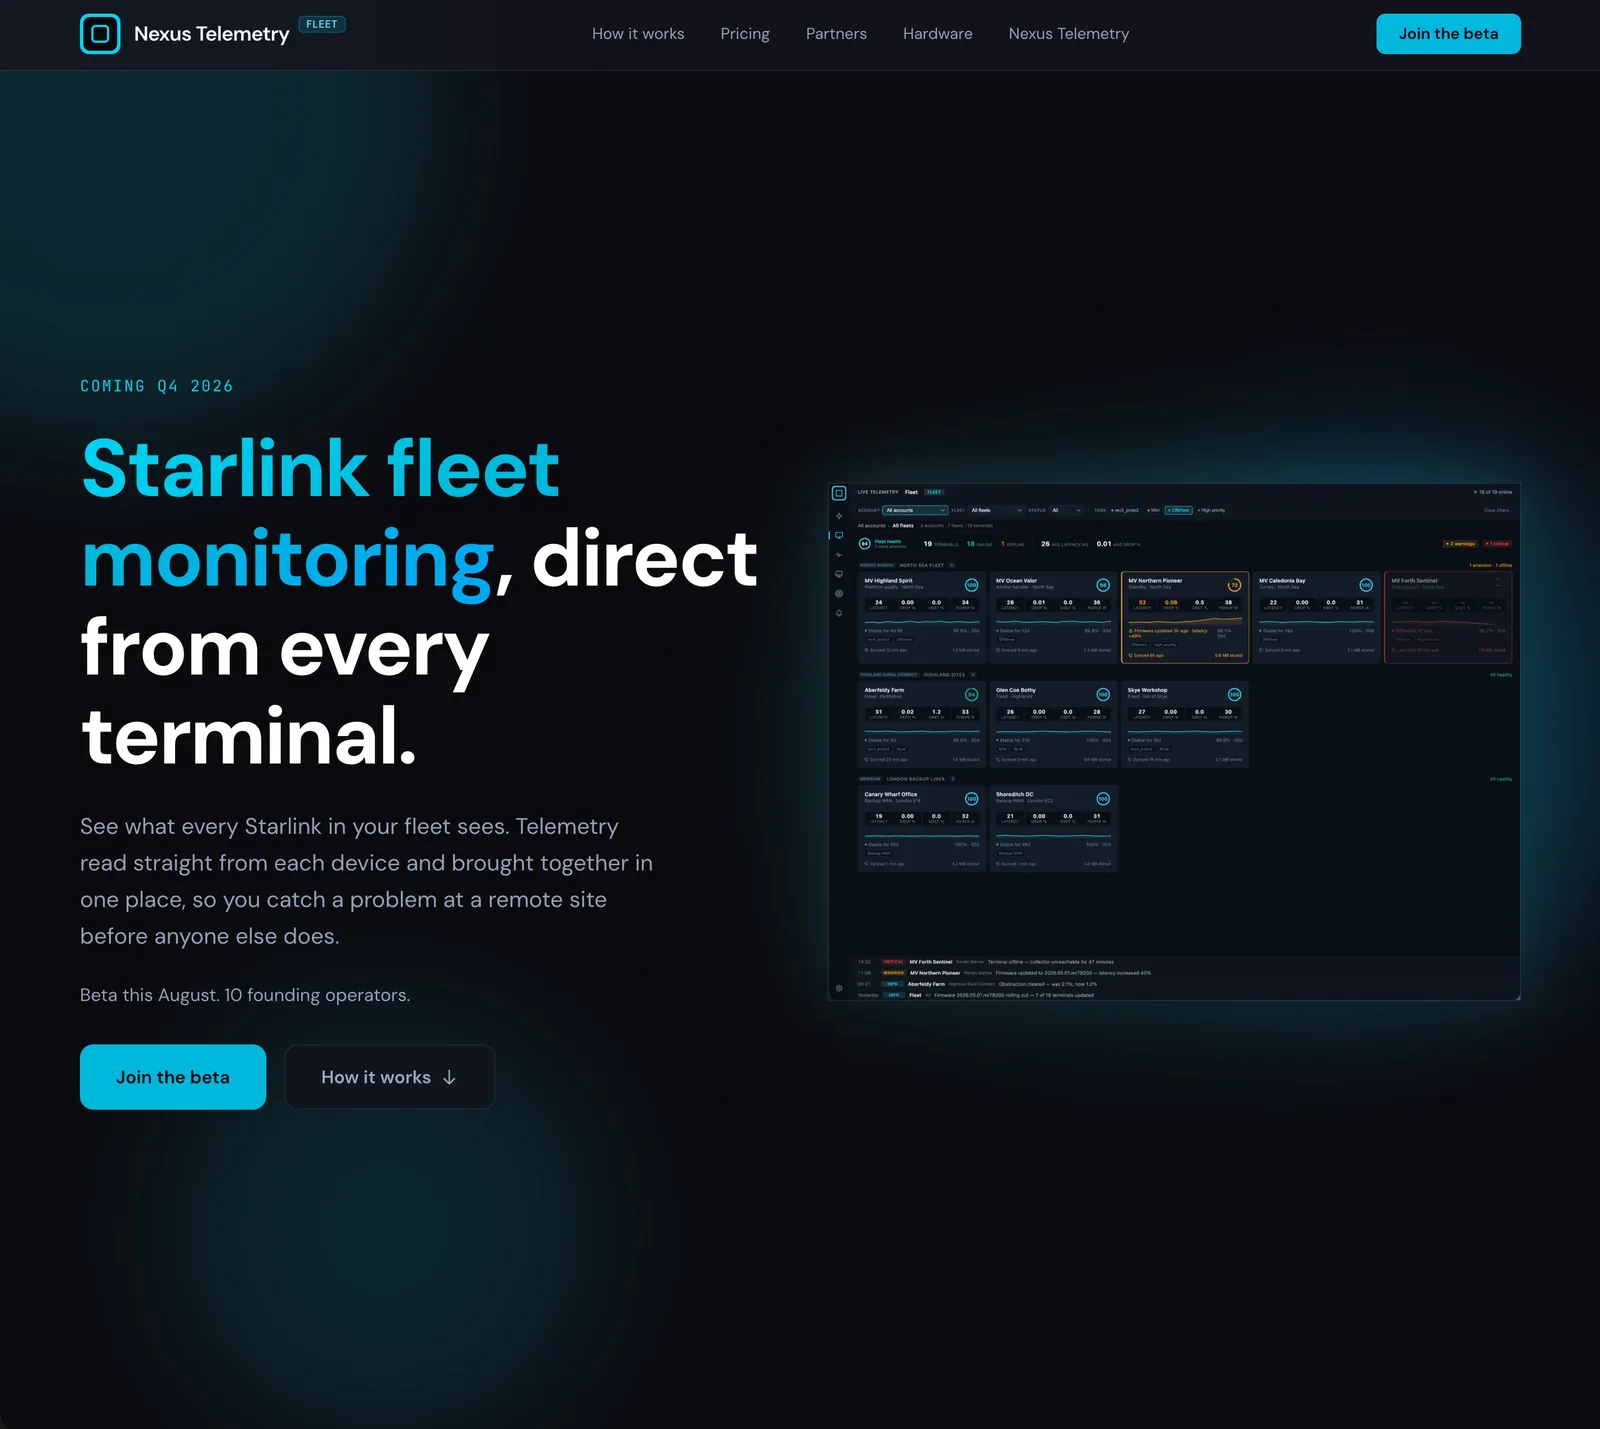
From there, you see your whole fleet in one place: which terminals are up, which need attention, and the full detail of any dish a click away. You get alerted the moment something needs you.
A fleet view has a different job from a single-dish view. Its job is triage. When everything is healthy the screen should feel calm, and the moment a terminal degrades it should stand out without anyone having to scan a table to find it. So the top-level view stays deliberately simple, and the deep telemetry sits a click underneath, ready when you need to understand what actually happened.
If you want the architecture in detail, how collection is separated from visualisation, the data hierarchy, the no-cloud design, it’s in the earlier write-up: Distributed Fleet Monitoring.
Why we built it the way we did
We spent three years building the first Starlink Enterprise management platform for a major reseller, so we know exactly what the enterprise API gives you and where it stops. It can tell you a terminal is online and roughly how it’s doing. It can’t tell you what the obstruction map looks like, how alignment has shifted, what happened second by second during an outage, or whether a firmware update helped or hurt a specific terminal. That data only exists on the local network, and only if something is there to collect it.
So we put the collector at the dish, kept the data local, and made the whole thing independent of who you bought your Starlink from. Works with any Starlink, no API keys, no permission needed. Just install and start monitoring.
Your way to run it
Same product, deployed the way that suits you:
- Self-hosted. Run the fleet server on your own infrastructure. Your data never leaves your network. Right for privacy-first and air-gapped operations.
- Managed cloud. We run the server, you log in and watch your fleet. Nothing to run yourself.
- Dedicated. Your own isolated instance, with an SLA and a named contact. Built for regulated, government, and large fleets.
And if you’re a reseller or a partner, you can offer the whole thing under your own brand, manage every customer’s fleet from one place, each kept separate, with your name on the screen.
What founding operators get
Early access, hands-on support directly from us, and preferential pricing locked in, in exchange for real feedback as we harden it toward general release in Q4. No long contract, low commitment, and a direct line to shape what we build.
We’re keeping the beta small on purpose, so we can give each founding operator proper attention and pick the deployments we’ll learn the most from.
Get in
If you run multi-terminal Starlink, operators and resellers both, take a look and apply:
Happy to walk anyone through it, too. Reach me at contact@liquidbinary.co.uk.
Nexus Telemetry is built by Liquidbinary Ltd. Follow @nexustelemetry on X or subscribe to the newsletter for new posts.